Heatmap
Available since v3.1.0
Heatmaps visualize where visitors click and scroll on your pages — giving you an at-a-glance view of engagement patterns without watching individual replays. Use heatmaps to identify which elements attract the most attention, discover dead clicks, and understand how far down the page visitors actually scroll.
Enabling Heatmaps
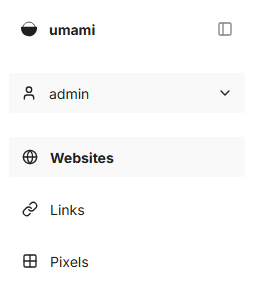
Log into Umami and click on Websites in the sidebar.
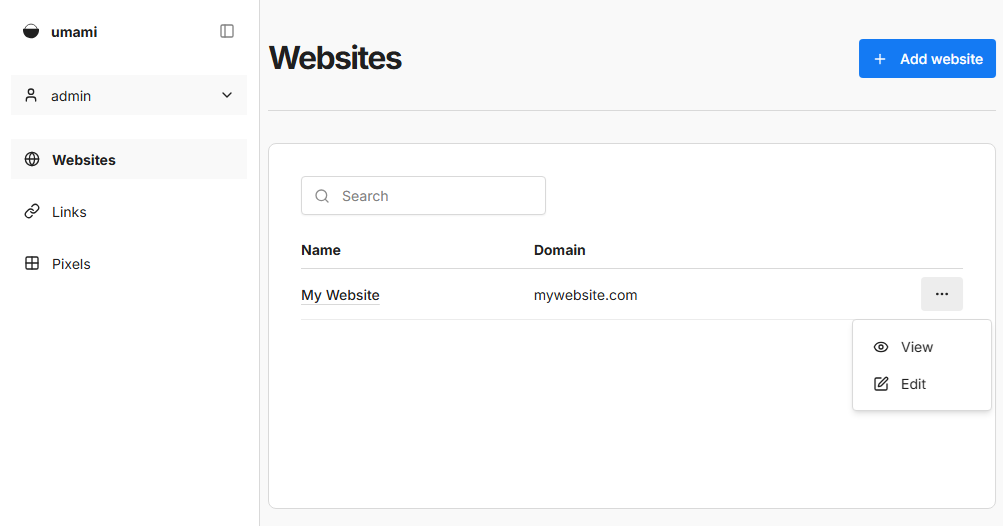
Click on the Edit button for the website you want to edit.
Navigate to the Replays & Heatmaps section and enable the Heatmaps toggle.
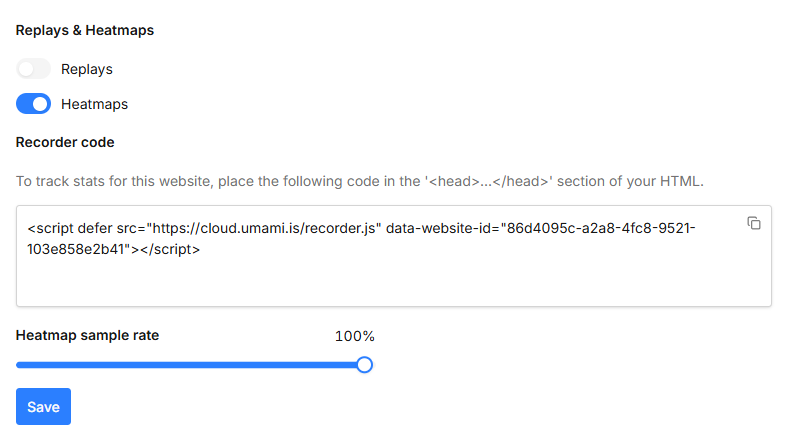
| Option | Description | Default |
|---|---|---|
| Heatmap Sample Rate | Fraction of sessions to include in heatmap data, from 0 to 1. | 0.15 |
You will also need to update your tracker script to opt in to heatmap collection.
<script
  defer src="http://localhost:3000/recorder.js"
  data-website-id="my-website-id"
></script>
Notes
- Heatmap data is only collected from sessions recorded after enabling the feature.
- Heatmaps are generated from aggregated session data — no individual session is identifiable.
Accessing Heatmaps
Navigate to a website and click the Heatmap tab.
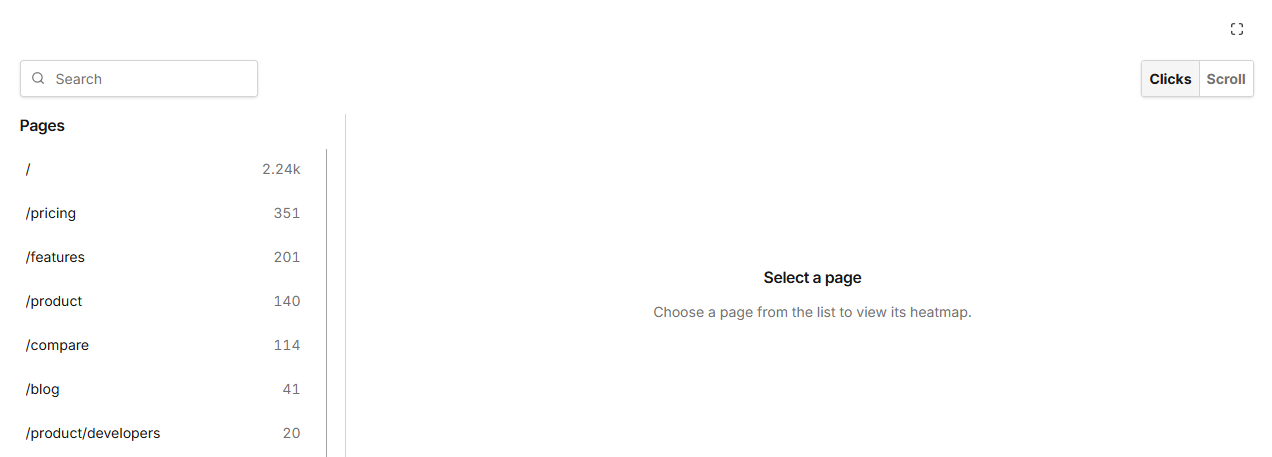
Use the Pages dropdown to select the page you want to inspect.
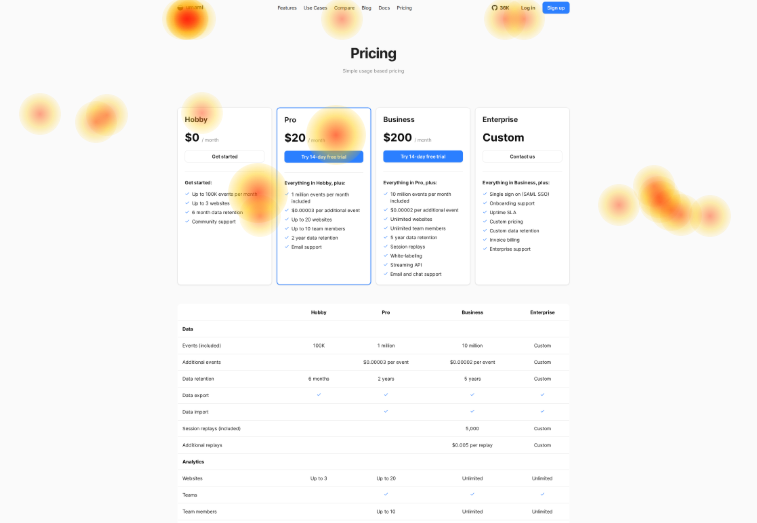
The heatmap overlay is rendered on top of a live snapshot of the page.
Heatmap Types
Use the type selector to switch between views.
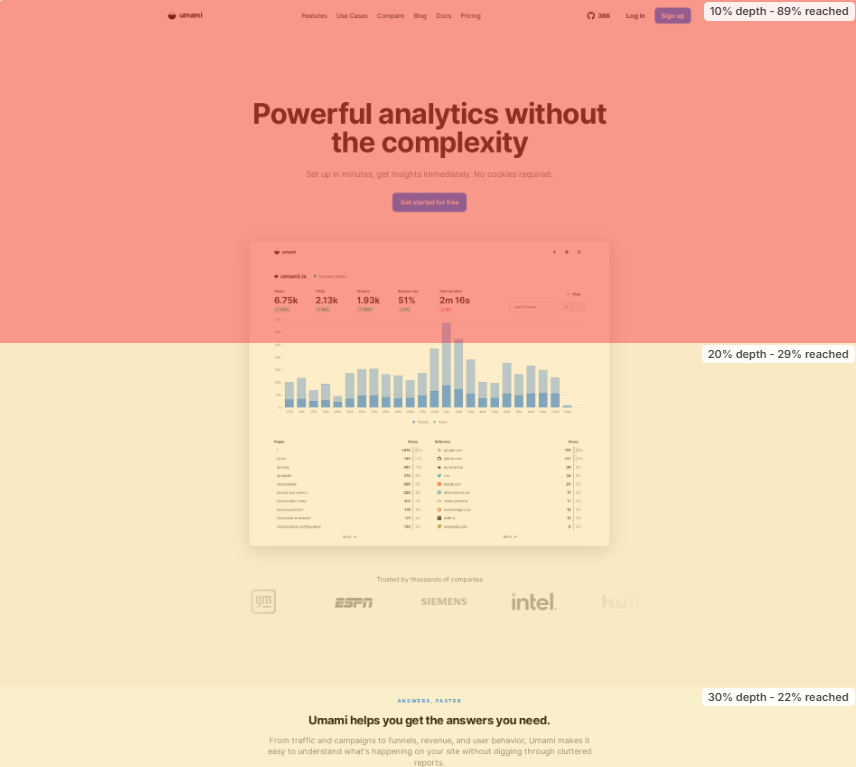
| Type | Description |
|---|---|
| Click | Shows where visitors click. Highlights high-engagement elements and dead clicks. |
| Scroll | Shows how far down the page visitors scroll. Useful for identifying content below the fold that goes unseen. |