Retention
Available since v2.5.0
Umami Retention measures your website's stickiness by tracking how often users return. This insight provides data into how many users continue to engage with your website over time, helping you understand and improve long-term user loyalty.
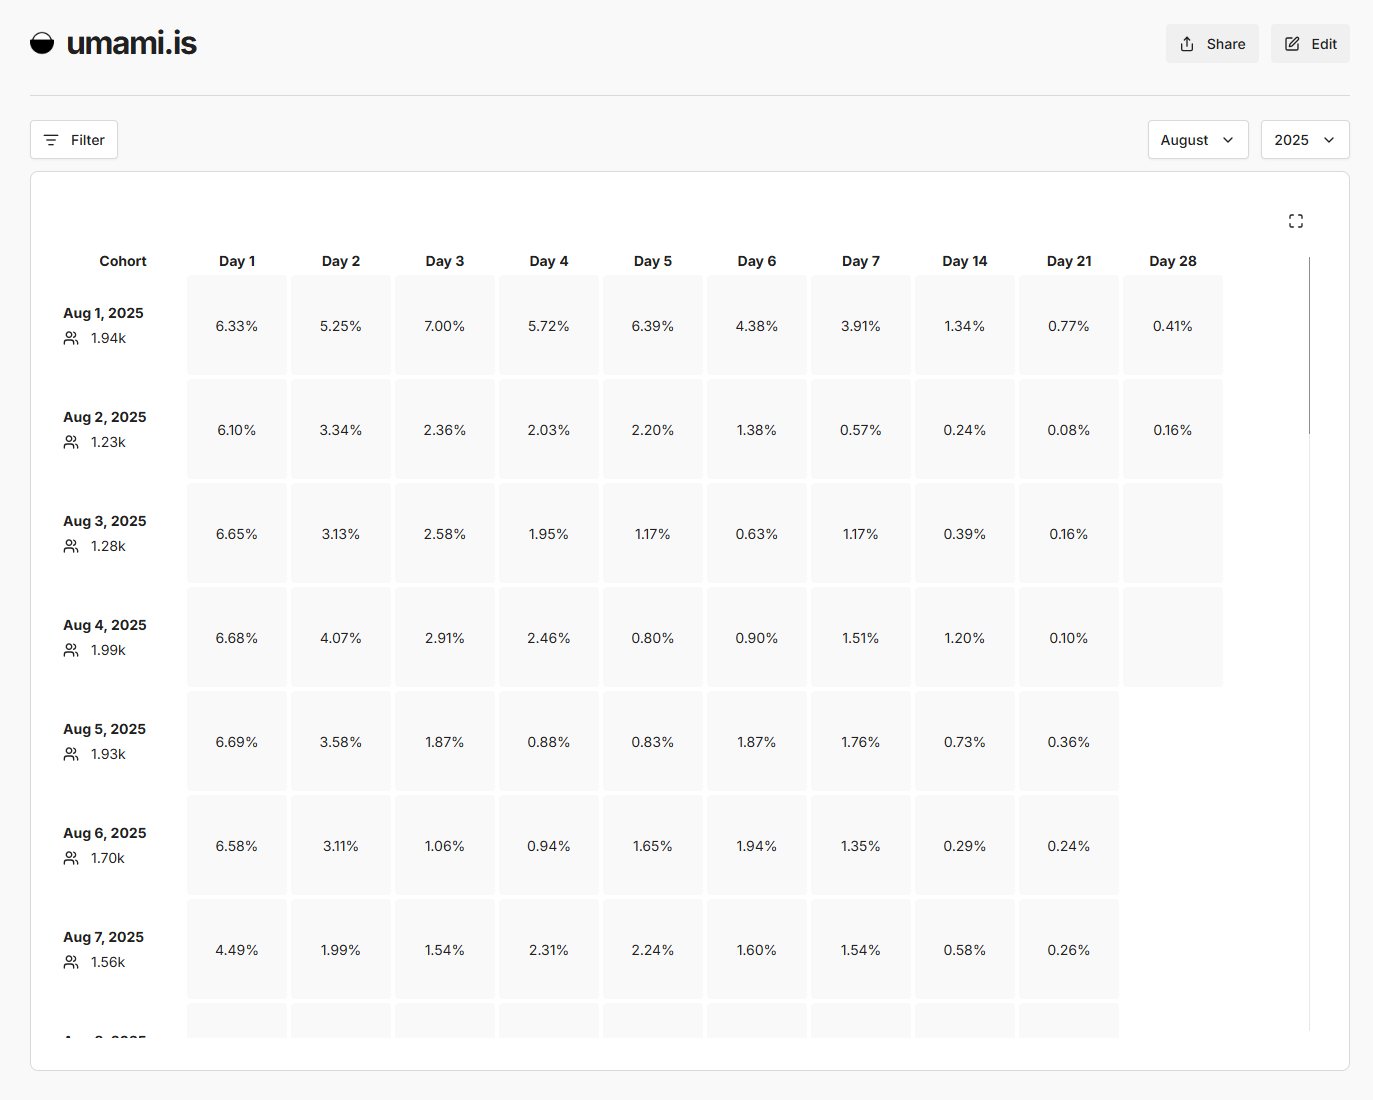
The insight uses a cohort analysis chart, offering valuable insights into the long-term retention trends and performance of distinct user cohorts. The chart is broken down into distinct visitors per day and how often those users return on specific days following the first initial visit.
Reading the chart
The retention chart is organized as a grid:
- Rows represent cohorts of users grouped by the day they first visited your website.
- Columns represent subsequent days after the initial visit (Day 1, Day 2, etc.).
- Cell values show the percentage of users from that cohort who returned on that day.
For example, if a cohort shows 40% on Day 1, it means 40% of the users who first visited on that day came back the following day. Higher retention percentages indicate stronger user engagement and content relevance.
Parameters
| Parameter | Description |
|---|---|
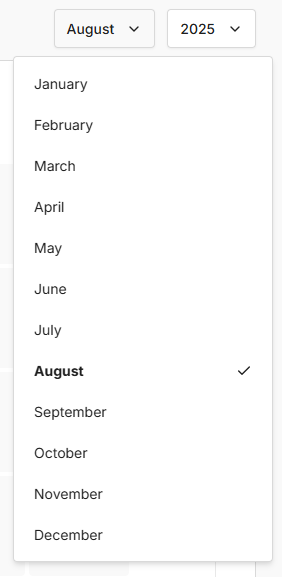
| Date | (required) The desired month and year of the insight. |
Create an insight
Step 1: Choose a date (month and year)
Step 2: Run insight