Performance
Available since v3.1.0
Performance tracks real-user Core Web Vitals collected directly from your visitors' browsers. Use it to identify slow pages, spot regressions over time, and compare performance across devices and browsers.
Use Cases
- Identify slow-loading pages that may be hurting user experience or SEO rankings.
- Compare Core Web Vitals across different devices, browsers, and regions.
- Validate the impact of performance improvements over time.
Usage
Add the data-performance attribute to your tracking script to enable automatic collection of Core Web Vitals.
<script
  defer
  src="http://mywebsite.com/umami.js"
  data-website-id="94db1cb1-74f4-4a40-ad6c-962362670409"
  data-performance="true"
></script>
Once enabled, Umami will automatically capture performance metrics from your visitors' browsers and report them under the Performance tab for that website.
Metrics
| Metric | Description |
|---|---|
| LCP | Largest Contentful Paint — time until the largest visible element is rendered. |
| INP | Interaction to Next Paint — responsiveness of the page to user interactions. |
| CLS | Cumulative Layout Shift — visual stability; lower is better. |
| FCP | First Contentful Paint — time until the first content is rendered on screen. |
| TTFB | Time to First Byte — time from request to first byte received from the server. |
Thresholds
Each metric is rated against Google's defined thresholds:
| Metric | Good | Needs Improvement | Poor |
|---|---|---|---|
| LCP | < 2,500 ms | 2,500 – 4,000 ms | > 4,000 ms |
| INP | < 200 ms | 200 – 500 ms | > 500 ms |
| CLS | < 0.1 | 0.1 – 0.25 | > 0.25 |
| FCP | < 1,800 ms | 1,800 – 3,000 ms | > 3,000 ms |
| TTFB | < 800 ms | 800 – 1,800 ms | > 1,800 ms |
Percentiles
Results are displayed at three percentile levels:
| Percentile | Description |
|---|---|
| p50 | Median — half of users experience this or better. |
| p75 | 75th percentile — the value most users experience. Google uses this for Core Web Vitals scoring. |
| p95 | 95th percentile — represents the worst-case experience for most users. |
Viewing Performance
Navigate to a website and click the Performance tab.
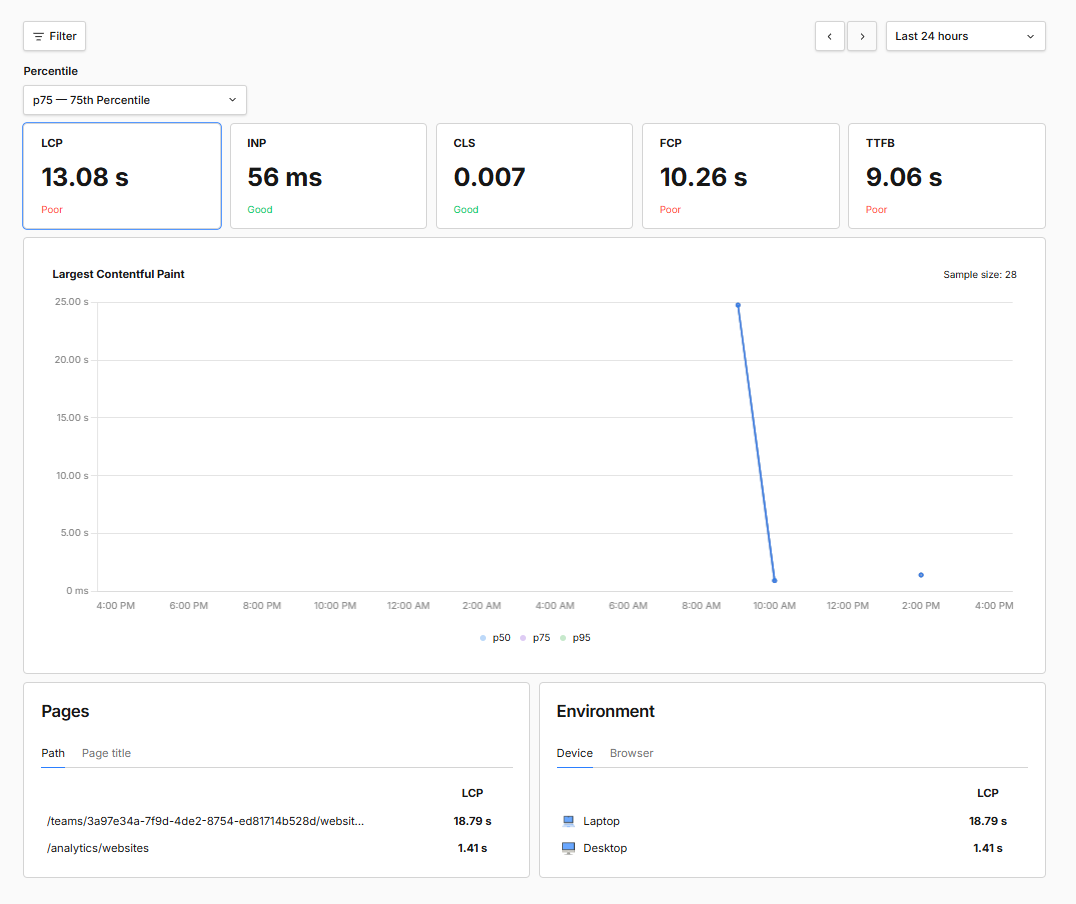
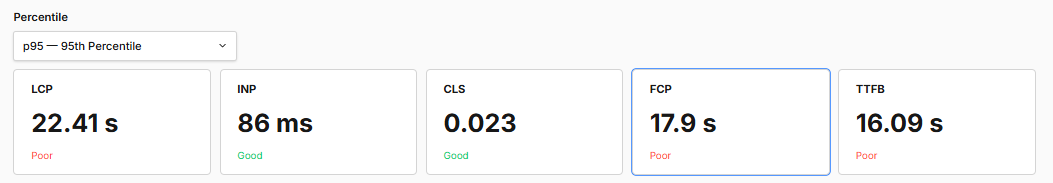
Select a metric card to focus the chart on that metric. Use the Percentile dropdown to switch between p50, p75, and p95.
Pages and Environment breakdowns
The bottom of the page shows the selected metric broken down by Pages (path or title) and Environment (device or browser), helping you pinpoint which pages or clients are underperforming.