Heatmaps
Available since v3.2.0
Heatmaps visualize where visitors click and scroll on your pages — giving you an at-a-glance view of engagement patterns without watching individual replays. Use heatmaps to identify which elements attract the most attention, discover dead clicks, and understand how far down the page visitors actually scroll.
Enabling Heatmaps
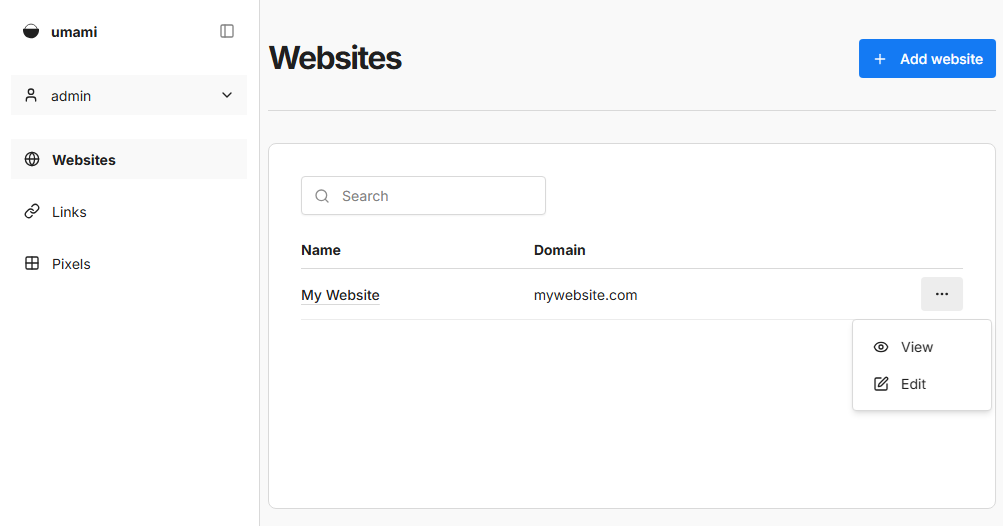
Log into Umami and click on Websites in the sidebar.
Click on the Edit button for the website you want to edit.
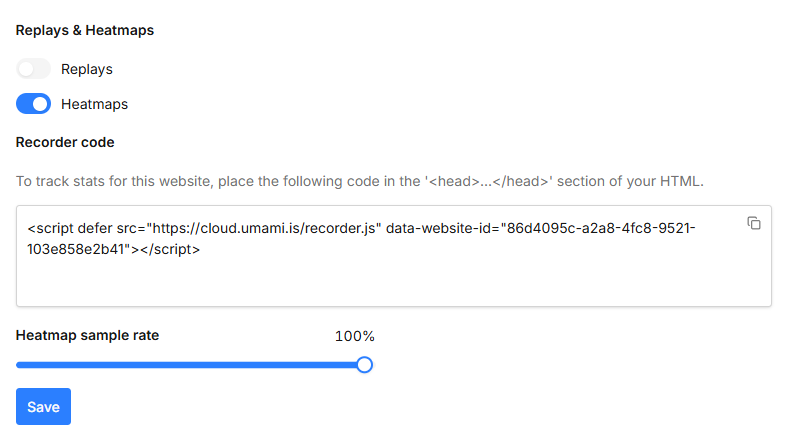
Navigate to the Replays & Heatmaps section and enable the Heatmaps toggle.
| Option | Description | Default |
|---|---|---|
| Heatmap Sample Rate | Fraction of sessions to include in heatmap data, from 0 to 1. | 0.15 |
Add the recorder script to your site. This enables heatmap event collection.
<script
  defer src="http://localhost:3000/recorder.js"
  data-website-id="my-website-id"
></script>
Notes
- Heatmap data is only collected from sessions recorded after enabling the feature.
- Heatmaps are generated from aggregated session data — no individual session is identifiable.
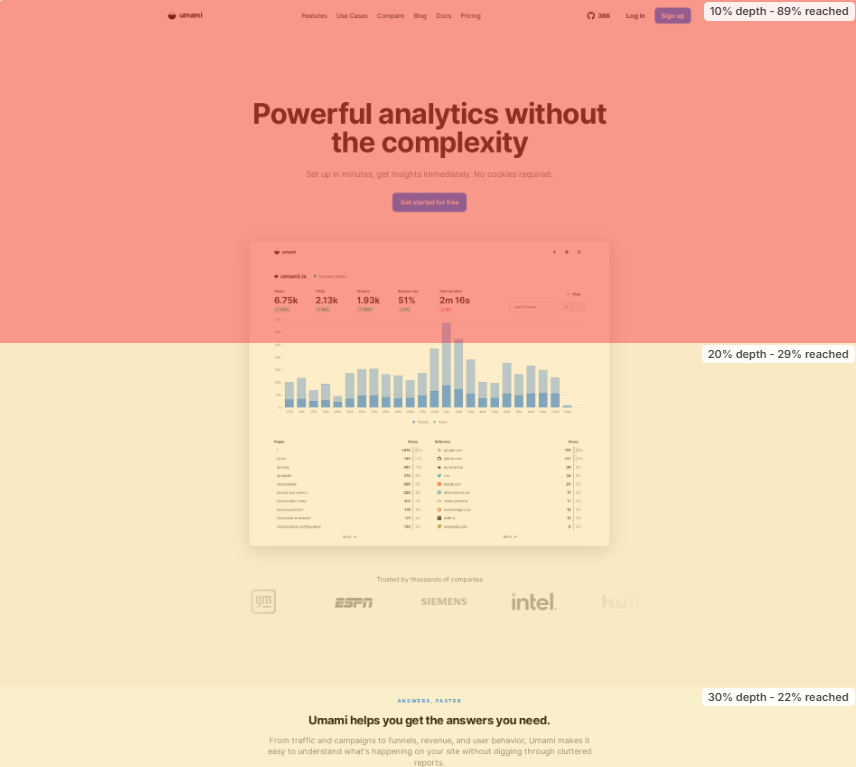
Page Overlay
The heatmap overlays click dots or scroll bands on top of a live preview of your page. Umami loads the actual page in an embedded frame using its captured URL — no screenshots, replays, or extra services are required.
If the preview can't load, the heatmap still shows click and scroll data on a blank canvas.
Allowing the page preview
The preview only loads if your page allows the Umami dashboard to embed it in an iframe. Most sites block framing by default, so you need to opt in by adding the dashboard's origin to a Content-Security-Policy frame-ancestors directive on the pages you want to inspect:
Content-Security-Policy: frame-ancestors 'self' https://your-umami-instance.com;Notes
- Use the origin where you access Umami in place of
https://your-umami-instance.com(for Umami Cloud, usehttps://cloud.umami.is).- If your site also sends
X-Frame-Options: DENYorSAMEORIGIN, remove it — it overridesframe-ancestorsin some browsers.
Accessing Heatmaps
Navigate to a website and click the Heatmap tab.
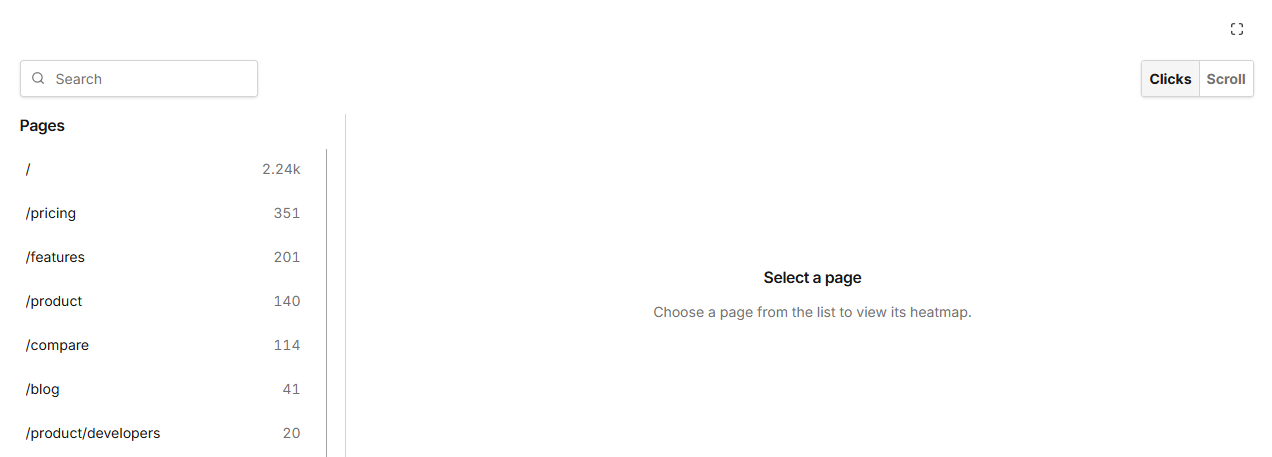
Use the Pages dropdown to select the page you want to inspect.
The heatmap overlay is rendered on top of a live preview of the page when one is available.
Heatmap Types
Use the type selector to switch between views.
| Type | Description |
|---|---|
| Click | Shows where visitors click. Highlights high-engagement elements and dead clicks. |
| Scroll | Shows how far down the page visitors scroll. Useful for identifying content below the fold that goes unseen. |
Screen Width
Because responsive pages render differently across devices, heatmap data is grouped by the visitor's screen width. Use the Screen width selector to switch between the available widths and view the overlay for each layout.
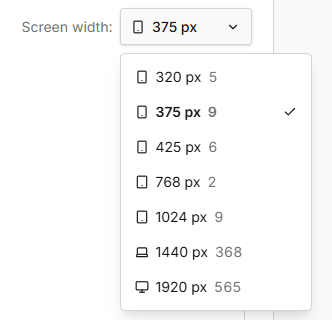
Each option shows a device icon and the number of recorded sessions at that width. Widths with no data are disabled, and the view defaults to the width with the most sessions.